Project Alumni: Kasra Manavi, Shuvra Nath, Guang Song, Xinyu Tang, Lydia Tapia
Interns and undergrad students: Katarzyna Leyk
Supported By: NSF
Interns and undergrad students: Katarzyna Leyk
Supported By: NSF
 |
It has recently been found that some RNA functions are determined by the actual folding process itself and not just the RNA's nucleotide sequence or its native structure. In this work, we present new computational tools that can be used to study kinetics-based functions for RNA such as population kinetics, folding rates, and the folding of particular subsequences. Previously, these properties could only be studied for small RNA whose conformation space could be enumerated (e.g., RNA with 30-40 nucleotides) or for RNA whose kinetics were restricted in some way. In this work, we provide computational tools to approximate the folding energy landscape and extract both global properties and detailed features of the folding process. The key advantage of our approach over other computational techniques is that it is fast and effiecient while bridging the gap between high-level folding events and low level folding details. Previously, we successfully applied this strategy to study folding landscapes.
Our method first builds an approximate map (or model) of the RNA's folding energy landscape. Then, to study the global folding kinetics, we use the master equation, a matrix of differential equations to describe the population kinetics of teh RNA. It allows us to discover features such as folding rates, transitions rates, and folding pathways. Next, to study some low-level folding details, we use our new analysis technique, called Map-based Monte Carlo (MMC) simulation, to stochastically extract folding pathways from the map. MMC, in conjunction with a novel sampling strategy (Boltzmann Statistical Sampling -BSS) for building the map, enables us to study kinetics-based functions for large RNA, e.g., RNA with 200+ nucleotides.
We provide several different simulation results to validate our method against known experimental data. We also show how our method can study kinetics-based functions for two different case studies. First, we compare simulated folding rates for ColE1 RNAII (200 nucleotides) and its mutants against experimental rates and show that our method identifies the same relative folding order as seen experiment. Second, we predict the gene expression rates fo wild-type MS2 phage RNA (135 nucleotides) and three of its mutants and show that our approach computes the same relative functionl rates as seen in experiment.
Here we demonstrate one of the folding pathways we extracted from our roadmap. The left figure displays the enerygy profile on this folding pathway. The right animation (generated by rnamovies) shows the folding process from a misfolded conformation into the native conformation. In order to folding to the native conformation from the misfolded state, the molecule must pass through an energy barrier.
 |
 |
| Energy profile | Folding pathway |
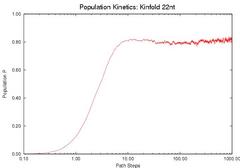
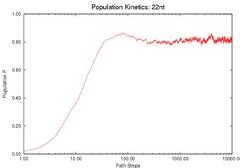
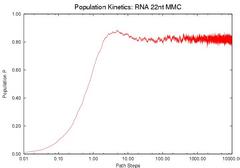
To validate our description of the enerfy landscape using roadmaps, we calculate the population kinetics from our roadmaps and compare them with the results calculated by standard Monte Carlo simulation. The figure below compares the population kinetics of the native state of 1k2g (CAGACUUCGGUCGCAGAGAUAGG) using (a) standard Monte Carlo simulation (implented by Kinfold), (b) Map-based Monte Carlo (MMC) simulation on a fully enumerated Base-pair (BP) roadmap (12.137 conformations), (c) Map-based Monte Carlo (MMC) simulation on a roadmap with our new Boltsmann statistical sampling (BSS) method (42 conformations), and (d) the master equation (ME) on a BSS roadmap (42 conformations). The BP roadmaps is the most accurate representation while the BSS roadmaps yields much smaller subsets of the entire conformation space that effectively approximate the energy landscape.
All population kinetics curves have similar features. Also note that the equilibrium (final) distributions are all the same, even though the Boltzmann statistical-sampling roadmap (c) and (d) contains less than 0.4% of all possible conformations. Thus, these roadmaps capture the main features of the energy landscape. This data validates that these analysis methods are interchangeable. We also did some quantitative comparisons on the master equation results, see our papers for more details.
 |
 |
 |
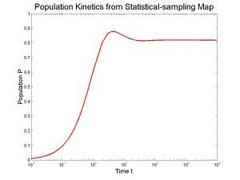 |
| Monte Carlo (by Kinfold) | MMC on Base-pair map | MMC on BSS map | ME on BSS map |
| Comparison of the Population Kinetics calculated using different methods. | |||
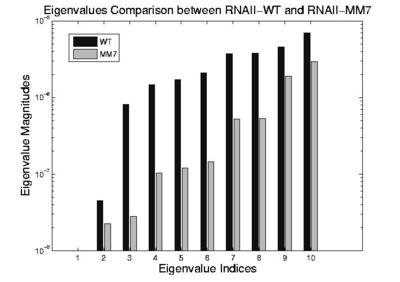
ColE1 RNAII (200 nucleotides) regulates the replication of E. coli ColE1 plasmids through this folding kinetics. The slower it folds, the higher the plasmid replication rate. A specific mutant, MM7, differts from the wild-type (WT) by a single nucleotide out of the 200 nucleotide sequence. This mutation causes it to fold slower while maintaining the same thermodynamics of the native state. Thus, the overall plasmid replication rate increases in the presence of MM7 over the WT. In the figure below, we compare simulated folding rates for ColE1 RNAII and its mutants against experimental rates. It shows the eigenvalues calculated using the master equation. Note that the smallest non-zero eigenvalues correspond to the folding rate. All eigenvalues of WT are larger than MM7 indicating that WT folds faster than MM7. It shows that our method identifies the same relative folding order as seen in experiment.
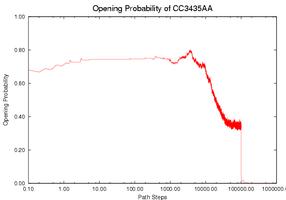
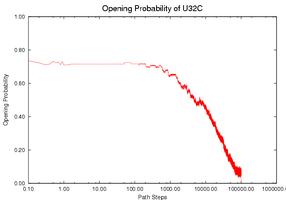
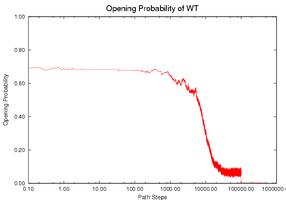
Prediction fo the Gene Expression Rates of MS2 pahge RNA: MS2 phage RNA (135 nucleotides) regulates the expression rate of phage MS2 maturation protein at the translational level. It works as a regulator only when a specific subsequence (the SD sequence) is open (i.e., does not form base-pair contacts). Three mutants have been studied that have similar thermodynamic properties with the wild-type (WT) but different kinetics and therefore different gene expression rate. Intuitively, the functional rate (e.g., gene expression rate in this case) is correlated with the opening of the SD sequence. If the SD sequence is opened longer, or has higher opening probability (i.e., having more nucleotides on the SD sequence open), then the mutant should have higher functional rate. We use our simulation method to study this opening probability during the folding process. Note that mutant CC3435AA has the longest duration at a relatively high level of opening probability while mutant SA has the shortest duration. This correlates with experimental data. The opening probability of U32C decreases earlier but finishes later than WT, so it is not clear which one has a larger total opening probability during folding, again matching experimental findings.
 |
 |
 |
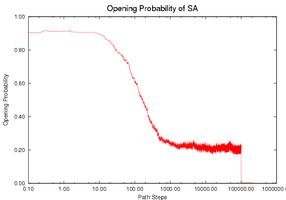 |
| CC3435AA | U32C | WT | SA |
| Comparison of the SD opening probability during the folding process. | |||
The gene expression rate is determined from two factors: (1) how high the opening probability is at any given time and (2) how long the RNA stays in the high opening probability state. To compare each RNA quantitatively, we compute the integration of the opening probability over the whole folding process. Note that the RNA regulates gene expression only when the SD opening probability is ``high enough''. We used thresholds ranging from 0.1 to 0.6 to estimate the gene expression rate. Thresholds higher than 0.6 will yield zero opening probability on WT and most mutants and thus cannot be correlated to experimental results. The table below shows the results for the WT and for each mutant. For most thresholds, mutant CC3435AA has the highest rate and mutant SA has the lowest rate, the same relative functional rate as seen in experiment. In addition WT and mutant U32C have similar levels (particularly between 0.4-0.6), again correlating with experimental results. Aside from simply validating our method against experiment, we can also use our method to suggest that the SD sequence may only be active for gene regulation when more than 40% of its nucleotides are open.
| Mutant | Relative Expression Rate (with regard to WT) | Threshold | |||||
| 0.1 | 0.2 | 0.3 | 0.4 | 0.5 | 0.6 | ||
| SA | 0.1 | 20935.8 | 542.9 | 213.1 | 145.2 | 109.7 | 79.5 |
| WT | 1 | 6555.7 | 5831.6 | 5022.2 | 4427.8 | 3366.0 | 982.7 |
| U32C | 1 | 16577.5 | 12821.5 | 9379.5 | 6511.8 | 2826.8 | 1173.5 |
| CC3435AA | 5 | 42075.4 | 42075.4 | 42075.4 | 16770.1 | 11775.4 | 9649.7 |
Tools for Simulating and Analyzing RNA Folding Kinetics, Xinyu Tang, Shawna Thomas, Lydia Tapia, Nancy M. Amato, In. Proc. International Conference on Research in Computational Molecular Biology, Oaklanda, California, USA, Apr 2007. DOI: 10.1007/978-3-540-71681-5_19 @InProceedings{10.1007/978-3-540-71681-5_19, It has recently been found that some RNA functions are determined by the actual folding kinetics and not just the RNAâÃÂÃÂs nucleotide sequence or its native structure. We present new computational tools for simulating and analyzing RNA folding kinetic metrics such as population kinetics, folding rates, and the folding of particular subsequences. Our method first builds an approximate representation (called a map) of the RNAâÃÂÃÂs folding energy landscape, and then uses specialized analysis techniques to extract folding kinetics from the map. We provide a new sampling strategy called Probabilistic Boltzmann Sampling (PBS) that enables us to approximate the folding landscape with much smaller maps, typically by several orders of magnitude. We also describe a new analysis technique, Map-based Monte Carlo (MMC) simulation, to stochastically extract folding pathways from the map. We demonstrate that our technique can be applied to large RNA (e.g., 200+ nucleotides), where representing the full landscape is infeasible, and that our tools provide results comparable to other simulation methods that work on complete energy landscapes. We present results showing that our approach computes the same relative functional rates as seen in experiments for the relative plasmid replication rates of ColE1 RNAII and its mutants, and for the relative gene expression rates of MS2 phage RNA and its mutants.
Keywords: Computational Biology, RNA, Sampling-Based Motion Planning
Links : [Published] BibTex
author="Tang, Xinyu
and Thomas, Shawna
and Tapia, Lydia
and Amato, Nancy M.",
editor="Speed, Terry
and Huang, Haiyan",
title="Tools for Simulating and Analyzing RNA Folding Kinetics",
booktitle="Research in Computational Molecular Biology",
year="2007",
publisher="Springer Berlin Heidelberg",
address="Berlin, Heidelberg",
pages="268--282",
isbn="978-3-540-71681-5"
}
Abstract
Using Motion Planning to Study RNA Folding Kinetics, Xinyu Tang, Bonnie Kirkpatrick, Shawna Thomas, Guang Song, Nancy M. Amato, In Proc. Int. Conf. Comput. Molecular Biology (RECOMB), pp. 252-261, Mar 2004. DOI: 10.1145/974614.974648 @inproceedings{10.1145/974614.974648, We propose a novel, motion planning based approach to approximately map the energy landscape of an RNA molecule. Our method is based on the successful probabilistic roadmap motion planners that we have previously successfully applied to protein folding. The key advantage of our method is that it provides a sparse map that captures the main features of the landscape and which can be analyzed to compute folding kinetics. In this paper, we provide evidence that this approach is also well suited to RNA. We compute population kinetics and transition rates on our roadmaps using the master equation for a few moderately sized RNA and show that our results compare favorably with results of other existing methods.
Keywords: Computational Biology, RNA, Sampling-Based Motion Planning
Links : [Published] BibTex
author = {Tang, Xinyu and Kirkpatrick, Bonnie and Thomas, Shawna and Song, Guang and Amato, Nancy M.},
title = {Using Motion Planning to Study RNA Folding Kinetics},
year = {2004},
isbn = {1581137559},
publisher = {Association for Computing Machinery},
address = {New York, NY, USA},
url = {https://doi.org/10.1145/974614.974648},
doi = {10.1145/974614.974648},
abstract = {We propose a novel, motion planning based approach to approximately map the energy landscape of an RNA molecule. Our method is based on the successful probabilistic roadmap motion planners that we have previously successfully applied to protein folding. The key advantage of our method is that it provides a sparse map that captures the main features of the landscape and which can be analyzed to compute folding kinetics. In this paper, we provide evidence that this approach is also well suited to RNA. We compute population kinetics and transition rates on our roadmaps using the master equation for a few moderately sized RNA and show that our results compare favorably with results of other existing methods.},
booktitle = {Proceedings of the Eighth Annual International Conference on Resaerch in Computational Molecular Biology},
pages = {252–261},
numpages = {10},
keywords = {motion planning, RNA, folding kinetics},
location = {San Diego, California, USA},
series = {RECOMB \'04}
}
Abstract